
Peter G. Mayberry09.09.16
According to data compiled by the U.S. Department of Commerce (DOC) and the U.S. International Trade Commission (ITC), when it comes to international trade of nonwoven roll goods between the U.S. and the rest of the world, U.S. industry continues to ship more product to other countries than we import – both in terms of assessed value and weight – but with a dramatically shrinking margin between levels of exports versus imports.
Weight – as measured in kilograms, or Kg – has historically been used to compare U.S. exports and imports of nonwoven roll goods because it’s an objective “apples to apples” comparison that aggregates all the various subdivisions for nonwoven roll goods existing under the globally-recognized Harmonized Tariff Schedule designation HTS 5603.
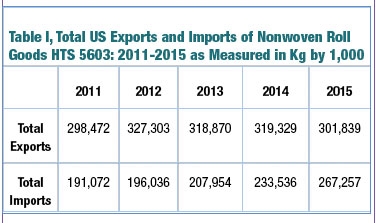 As Table I shows, measured by Kg, U.S. manufacturers continue to export considerably more nonwoven roll goods than that which is imported to the U.S. market:
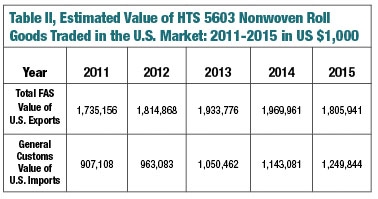
DOC & ITC also offer valuations for imports and exports, but these numbers compare different values – “General Customs Value” for imports to the U.S. versus “Free Alongside Value” for exports from the United States. Table II shows how both of these values have changed over the past five years.
Looking at these two tables, one reasonable top-line takeaway is that the value of U.S. exports, according to government statistics, has remained fairly static (rising from just under $1.8 billion in 2011 to just over $1.8 billion last year) while the value of imports to the U.S. has risen nearly 30% from just more than $9 million in 2011 to nearly $1.3 billion last year.
Similarly, when it comes to U.S. trade in nonwoven roll goods as measured by weight, U.S. government data indicate an overall increase of domestic exports of about 1% during the past five years—with significant declines between 2012 and 2015—while imports to the U.S. market have steadily advanced, growing more than 71% over the same period.
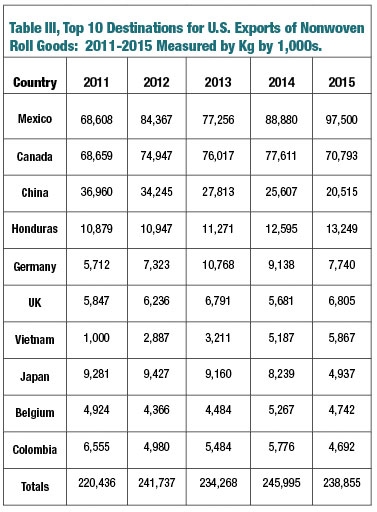
Breaking these data down by individual countries reveals that most U.S. exports typically remain within North America.
 As Table III shows, about 70% of nonwoven roll goods exported from the U.S. end up in either Mexico or Canada and business
has been especially good for U.S. manufacturers exporting to the Mexican market.
Beyond Mexico and Canada, Table III indicates that U.S. exports of nonwoven roll goods last year increased to Honduras, the U.K. and Vietnam but declined in Canada, China, Germany, Japan, Belgium, and Colombia.
Looking beyond the Top 10 destinations for U.S. exports, virtually all other markets around the world showed negative growth in 2015 for U.S.-produced HTS 5603 product. In all, there were some 40 countries that took small amounts of U.S. nonwoven roll goods between 2011-2014, but nothing last year.
 Drawing conclusions from these data is always tricky, but one clear sign is that globalization is alive and well with regard to nonwoven roll goods. Whereas the U.S. exported nearly three times the amount of HTS 5603 product as we imported just a few years ago, that gap has diminished tremendously and continues to close.
Weight – as measured in kilograms, or Kg – has historically been used to compare U.S. exports and imports of nonwoven roll goods because it’s an objective “apples to apples” comparison that aggregates all the various subdivisions for nonwoven roll goods existing under the globally-recognized Harmonized Tariff Schedule designation HTS 5603.
DOC & ITC also offer valuations for imports and exports, but these numbers compare different values – “General Customs Value” for imports to the U.S. versus “Free Alongside Value” for exports from the United States. Table II shows how both of these values have changed over the past five years.
Looking at these two tables, one reasonable top-line takeaway is that the value of U.S. exports, according to government statistics, has remained fairly static (rising from just under $1.8 billion in 2011 to just over $1.8 billion last year) while the value of imports to the U.S. has risen nearly 30% from just more than $9 million in 2011 to nearly $1.3 billion last year.
Similarly, when it comes to U.S. trade in nonwoven roll goods as measured by weight, U.S. government data indicate an overall increase of domestic exports of about 1% during the past five years—with significant declines between 2012 and 2015—while imports to the U.S. market have steadily advanced, growing more than 71% over the same period.
Breaking these data down by individual countries reveals that most U.S. exports typically remain within North America.
Beyond Mexico and Canada, Table III indicates that U.S. exports of nonwoven roll goods last year increased to Honduras, the U.K. and Vietnam but declined in Canada, China, Germany, Japan, Belgium, and Colombia.
Looking beyond the Top 10 destinations for U.S. exports, virtually all other markets around the world showed negative growth in 2015 for U.S.-produced HTS 5603 product. In all, there were some 40 countries that took small amounts of U.S. nonwoven roll goods between 2011-2014, but nothing last year.