
Peter Mayberry, contributing editor09.09.15
Data from the U.S. International Trade Commission (ITC) indicate that 2010-2014 were strong years for U.S. exports of nonwoven roll goods classified under chapter 5603 of the globally-used Harmonized Tariff Schedule (HTS). In terms of free-alongside-value (FAS) for instance, ITC data show that the total FAS value for all roll goods exported from the U.S. grew from roughly $1.6 billion in 2010 to just shy of $2 billion last year – an impressive increase of nearly 20% over five years (please see Table 1).
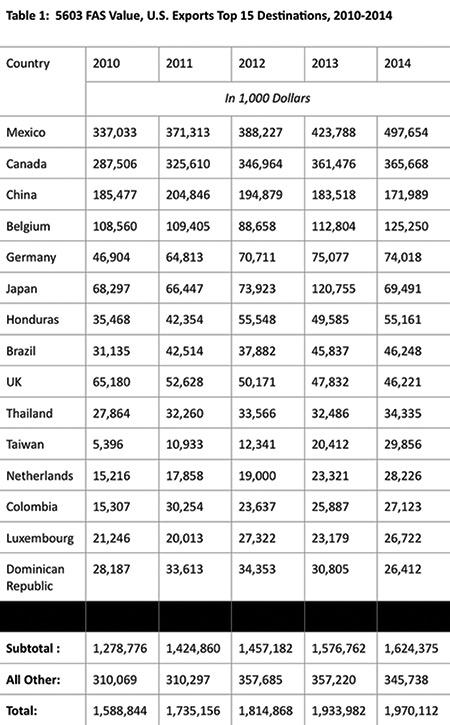
Interestingly, Table 1 also shows that the vast majority of FAS value for 5603 exports was derived from shipments to just 15 countries with exports to Mexico and Canada continuing to account for the largest percentages, which has been the case for at least 15 years.
FAS value is broader than just the value of the roll goods themselves in that FAS is defined as the “Transaction price of the merchandise including inland freight, insurance and other charges incurred in placing the merchandise alongside the carrier at the U.S. port of exportation.”
Realistically, therefore, some portion of the increased FAS values during the past five years could be the result of higher freight fees, insurance charges, and/or other costs getting the goods to a U.S. port, but it’s impossible to tease that consideration out of the ITC numbers.
Unfortunately, it’s also impossible to do an “apples to apples” value comparison between U.S. exports of roll goods to other countries versus the value of imports to the U.S. from abroad because government data for imports is based on Customs Import Value (CIV) instead of FAS.
CIV is defined as the “Price paid for merchandise when sold for exportation to the U.S.” and doesn’t differentiate additional costs for shipment, delivery, import duties, etc.
That said, Table II shows that the CIV value of 5603 imports to the U.S. has also been steadily increasing over the past five years – rising about 30% from just over $900 million in 2010 to a little more than $1.2 billion in 2014.
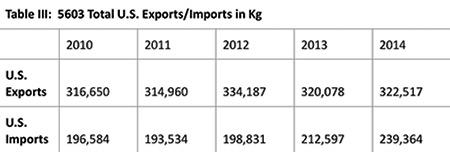
Instead of comparing the designated values of imports versus exports, therefore, the difference in kilograms (kg) is considered to be a more comparative means of measuring shipments of 5603 roll goods both into and out of the U.S.
As shown in Table III, total kg of nonwoven roll goods exported from the U.S. continues to be significantly higher than the amount of 5603 material coming into the country, but that margin has narrowed quite a bit over the past five years.
As Table III shows, the U.S. exported 120,000 kg more nonwoven roll goods than were imported in 2010, but by 2014 the U.S. only exported 84,000 kg more than were imported.
In terms of roll goods imported to the U.S., the top 10 countries that shipped 5603 product to the U.S. Note the colossal growth in imports from China – climbing from about 43 million kg in 2010 to nearly 74 million kg last year; an increase of around 75%.
Even more interesting, Chinese exports of nonwoven roll goods jumped from 59 million kg in 2013 to about 74 million kg in 2014–an increase of about 30% in just one year. No other country comes close to the amount of nonwovens roll goods being shipped to the U.S.
by China when measured by kg.
Imports from India have also seen a nice rise during the past five years—nearly doubling from about seven million kg in 2010 to almost 14 million last year and imports from Taiwan more than doubled from about four million kg in 2010 to more than eight million kg last year.
Growth in imports from most other countries in the top 10 list was more incremental and imports from Mexico and France actually declined during the past five years.
The final table lists the top 10 destinations for nonwoven roll goods exported from the U.S. last year as measured by kilograms instead of FAS value.
As the table notes, U.S. exports within North America have grown nicely during the last five years. Exports to Mexico climbed from about 66 million kg in 2010 to almost 90 million kg last year, an increase of about 30%. Exports to Canada climbed from a little less than 70 million kg in 2010 to about 78 million in 2014, showing growth of about 13%.
When it comes to U.S. exports of nonwoven roll goods, the bad news shown in Table V is that shipments from the U.S. have declined during the past five years to: China (falling from 39 million kg in 2010 to 26 million in 2014), Japan (dropping from 11 million kg in 2010 to just over 8 million kg last year), the U.K. (about 6 million kg last year compared to 13 kg in 2010) and Thailand (a modest decrease from 6.2 million kg in 2010 to about 5.6 million in 2014).
Taken together these data provde just how global the nonwovens industry has become in recent years and illustrate how U.S.

dominance over the industry has faded during the past 10 years or so. They also suggest the potential that the Trans-Pacific Partnership (TPP) negotiations offer U.S.-based exporters of nonwoven roll goods. Considering that countries which are part of these negotiations—especially Brunei and Japan—as well as countries which have expressed interest in joining the negotiations but aren’t currently formal parties to the talks – such as Philippines, Thailand and Taiwan – a successful TPP agreement could offer new market opportunities for U.S. exports of nonwoven roll goods.
Indeed, considering that the U.S. already has free trade agreements with three countries on the list of top 10 export destinations for 5603 roll goods, a TPP that opens up five new markets to duty-free exports from the U.S. could be quite helpful over time. But these will definitely be competitive markets that other countries in the TPP negotiations will be watching carefully for their own export opportunities.
FAS value is broader than just the value of the roll goods themselves in that FAS is defined as the “Transaction price of the merchandise including inland freight, insurance and other charges incurred in placing the merchandise alongside the carrier at the U.S. port of exportation.”
Realistically, therefore, some portion of the increased FAS values during the past five years could be the result of higher freight fees, insurance charges, and/or other costs getting the goods to a U.S. port, but it’s impossible to tease that consideration out of the ITC numbers.
Unfortunately, it’s also impossible to do an “apples to apples” value comparison between U.S. exports of roll goods to other countries versus the value of imports to the U.S. from abroad because government data for imports is based on Customs Import Value (CIV) instead of FAS.
CIV is defined as the “Price paid for merchandise when sold for exportation to the U.S.” and doesn’t differentiate additional costs for shipment, delivery, import duties, etc.
That said, Table II shows that the CIV value of 5603 imports to the U.S. has also been steadily increasing over the past five years – rising about 30% from just over $900 million in 2010 to a little more than $1.2 billion in 2014.
Instead of comparing the designated values of imports versus exports, therefore, the difference in kilograms (kg) is considered to be a more comparative means of measuring shipments of 5603 roll goods both into and out of the U.S.
As shown in Table III, total kg of nonwoven roll goods exported from the U.S. continues to be significantly higher than the amount of 5603 material coming into the country, but that margin has narrowed quite a bit over the past five years.
As Table III shows, the U.S. exported 120,000 kg more nonwoven roll goods than were imported in 2010, but by 2014 the U.S. only exported 84,000 kg more than were imported.
In terms of roll goods imported to the U.S., the top 10 countries that shipped 5603 product to the U.S. Note the colossal growth in imports from China – climbing from about 43 million kg in 2010 to nearly 74 million kg last year; an increase of around 75%.
Even more interesting, Chinese exports of nonwoven roll goods jumped from 59 million kg in 2013 to about 74 million kg in 2014–an increase of about 30% in just one year. No other country comes close to the amount of nonwovens roll goods being shipped to the U.S.
Imports from India have also seen a nice rise during the past five years—nearly doubling from about seven million kg in 2010 to almost 14 million last year and imports from Taiwan more than doubled from about four million kg in 2010 to more than eight million kg last year.
Growth in imports from most other countries in the top 10 list was more incremental and imports from Mexico and France actually declined during the past five years.
The final table lists the top 10 destinations for nonwoven roll goods exported from the U.S. last year as measured by kilograms instead of FAS value.
As the table notes, U.S. exports within North America have grown nicely during the last five years. Exports to Mexico climbed from about 66 million kg in 2010 to almost 90 million kg last year, an increase of about 30%. Exports to Canada climbed from a little less than 70 million kg in 2010 to about 78 million in 2014, showing growth of about 13%.
When it comes to U.S. exports of nonwoven roll goods, the bad news shown in Table V is that shipments from the U.S. have declined during the past five years to: China (falling from 39 million kg in 2010 to 26 million in 2014), Japan (dropping from 11 million kg in 2010 to just over 8 million kg last year), the U.K. (about 6 million kg last year compared to 13 kg in 2010) and Thailand (a modest decrease from 6.2 million kg in 2010 to about 5.6 million in 2014).
Taken together these data provde just how global the nonwovens industry has become in recent years and illustrate how U.S.