Peter Mayberry and Jessica Franken05.17.06
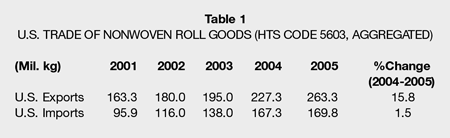
Based on import/export data that have recently been released by the U.S. government, 2005 was an outstanding year for the domestic nonwovens industry. Indeed, government-compiled statistics reveal that U.S. exports of nonwoven roll goods (categorized under Harmonized Tariff Schedule code 5603) hit a record high of more than 263 million kilograms (one kg = 2.2 pounds) shipped abroad (see Table 1) during 2005. But, perhaps even more importantly, export growth in 2005 dramatically outstripped import growth for the first time in years, increasing by nearly 16% while imports only increased by 1.5%. If this trend holds, it will be a dramatic reversal, to say the least.
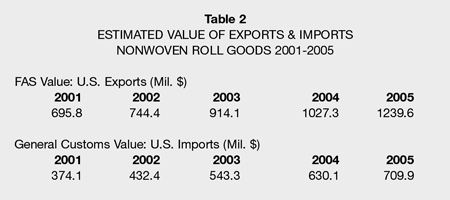
If that were not enough, exports also outpaced imports in terms of worth. As Table 2 illustrates, the estimated value of exported roll goods from the U. .S—as measured both by Free Along Side (FAS) value and General Customs Value—increased more than 20% in 2005, reaching a record of more than $1.2 billion in estimated worth last year. The value of imports also grew during 2005 but still only represents about 70% that of U.S. exports.
These data are especially significant because INDA, Association of the Nonwoven Fabrics Industry, has observed a narrowing in the gap between exports and imports of nonwoven roll goods during the past few years. The trend has been so noticeable, in fact, that INDA staff has repeatedly called it to the attention of U.S. government officials.
Between 2000 and 2004, for instance, imports of nonwoven roll goods to the U.S. nearly doubled while exports grew a much more modest 45%. Because of this, concerns were expressed that imported roll goods could surpass exports in the relatively near future. And while the 2005 data do not eliminate these concerns, they do represent the first bit of good news we have received in quite a while. It will still take several years of future data, however, to determine if 2005 was an anomaly or the beginning of a new trend.
As Table 3 shows, nearly half of U.S. roll goods exported during 2005 remained in North America, with shipments to Mexico and Canada increasing ever so slightly (.03%) compared to 2004. Interestingly, exports to our NAFTA partners have tapered off since 2002, when nearly 60% of all exported roll goods from the U.S. remained in North America.

And what about the remaining 51%? A survey of the "Top 10" export destinations in Table 4 (which account for more than 80% of U.S. exports) shows that nearly 20% of these exports are headed to Asian countries including China, Japan and Thailand. U.S. shipments of nonwoven roll goods to China nearly doubled, in fact, during 2005, a dramatic increase that, coupled with exports sent to Hong Kong, displaced the U.K. from the third place position it has held since the mid-1990s.
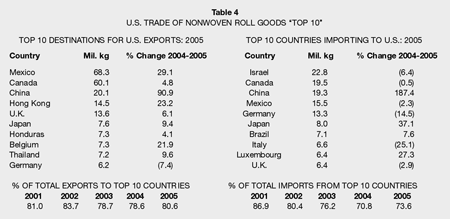
Also noteworthy is the fact that except for Germany, each one of the "Top 10" export destinations received more nonwovens from the U.S. than they had the year before. In addition, of the 101 different countries that received U.S. exports of nonwoven roll goods in 2005, 61 received more U.S. nonwovens than they had the year before.
Further, some 28 countries received more than 1 million kg of nonwovens from the U.S., with some showing particularly dramatic gains, including Spain (up 279% to 5.8 million kg), the Netherlands (up 100% to 4.8 million kg in 2005), Luxembourg (up 52% to 1.7 million kg), Russia (up 43% to 1.2 million kg) and the Philippines (up 49% to 1.1 million kg).
A few other members of the "Million Plus Club" are also worth mentioning. The Dominican Republic and Honduras, for example, imported 7.3 million kg and 2.8 million kg of roll goods, respectively, during 2005 and represent two of the six countries included in the U.S. free trade agreement with Central America (DR-CAFTA). And while that pact is still in the process of being implemented, we can probably expect shipments to these two countries, not to mention to the other four in the DR-CAFTA—Costa Rica, El Salvador, Guatemala and Nicaragua—to increase even more once the agreement is fully in effect. Saudi Arabia, which received 1.6 million kg of nonwovens in 2005, is another one to watch because it recently joined the World Trade Organization (WTO) and membership requires making commitments to cut import tariffs and taking other steps to liberalize markets.
On the import side, 53 countries sent nonwoven roll goods to the U.S. in 2005, with 25 of these countries shipping more nonwovens to the U.S. than they had the year before. At the same time, however, 14 countries posted losses in 2005, which might be explained at least partly by the fact that countries like China (which emerged as the third largest source of foreign nonwovens in 2005) may have eaten up some of their advantage after all global textile quotas were removed on January 1, 2005.
But China was not the only nation to post dramatic gains in 2005. Imports from the Czech Republic, for instance, skyrocketed 1276% in 2005 (rising from 110,000 kg in 2004 to 1.5 million kg), while nonwoven roll goods shipments from Taiwan to the U.S. were up by 86% (from 569,000 kg in 2004 to almost 1.1 million kg). And, while they shipped less than 1 million kg in 2005, several other countries witnessed significant increases in 2005, including Australia (up 243% from 271,000 kg in 2004 to nearly a million in 2005), Egypt (up 340% from 141,000 kg in 2004) and Malta (up 15,228% from 3000 kg in 2004).
If that were not enough, exports also outpaced imports in terms of worth. As Table 2 illustrates, the estimated value of exported roll goods from the U. .S—as measured both by Free Along Side (FAS) value and General Customs Value—increased more than 20% in 2005, reaching a record of more than $1.2 billion in estimated worth last year. The value of imports also grew during 2005 but still only represents about 70% that of U.S. exports.
These data are especially significant because INDA, Association of the Nonwoven Fabrics Industry, has observed a narrowing in the gap between exports and imports of nonwoven roll goods during the past few years. The trend has been so noticeable, in fact, that INDA staff has repeatedly called it to the attention of U.S. government officials.
Between 2000 and 2004, for instance, imports of nonwoven roll goods to the U.S. nearly doubled while exports grew a much more modest 45%. Because of this, concerns were expressed that imported roll goods could surpass exports in the relatively near future. And while the 2005 data do not eliminate these concerns, they do represent the first bit of good news we have received in quite a while. It will still take several years of future data, however, to determine if 2005 was an anomaly or the beginning of a new trend.
Export/Import Markets
As Table 3 shows, nearly half of U.S. roll goods exported during 2005 remained in North America, with shipments to Mexico and Canada increasing ever so slightly (.03%) compared to 2004. Interestingly, exports to our NAFTA partners have tapered off since 2002, when nearly 60% of all exported roll goods from the U.S. remained in North America.
And what about the remaining 51%? A survey of the "Top 10" export destinations in Table 4 (which account for more than 80% of U.S. exports) shows that nearly 20% of these exports are headed to Asian countries including China, Japan and Thailand. U.S. shipments of nonwoven roll goods to China nearly doubled, in fact, during 2005, a dramatic increase that, coupled with exports sent to Hong Kong, displaced the U.K. from the third place position it has held since the mid-1990s.
Also noteworthy is the fact that except for Germany, each one of the "Top 10" export destinations received more nonwovens from the U.S. than they had the year before. In addition, of the 101 different countries that received U.S. exports of nonwoven roll goods in 2005, 61 received more U.S. nonwovens than they had the year before.
Further, some 28 countries received more than 1 million kg of nonwovens from the U.S., with some showing particularly dramatic gains, including Spain (up 279% to 5.8 million kg), the Netherlands (up 100% to 4.8 million kg in 2005), Luxembourg (up 52% to 1.7 million kg), Russia (up 43% to 1.2 million kg) and the Philippines (up 49% to 1.1 million kg).
A few other members of the "Million Plus Club" are also worth mentioning. The Dominican Republic and Honduras, for example, imported 7.3 million kg and 2.8 million kg of roll goods, respectively, during 2005 and represent two of the six countries included in the U.S. free trade agreement with Central America (DR-CAFTA). And while that pact is still in the process of being implemented, we can probably expect shipments to these two countries, not to mention to the other four in the DR-CAFTA—Costa Rica, El Salvador, Guatemala and Nicaragua—to increase even more once the agreement is fully in effect. Saudi Arabia, which received 1.6 million kg of nonwovens in 2005, is another one to watch because it recently joined the World Trade Organization (WTO) and membership requires making commitments to cut import tariffs and taking other steps to liberalize markets.
On the import side, 53 countries sent nonwoven roll goods to the U.S. in 2005, with 25 of these countries shipping more nonwovens to the U.S. than they had the year before. At the same time, however, 14 countries posted losses in 2005, which might be explained at least partly by the fact that countries like China (which emerged as the third largest source of foreign nonwovens in 2005) may have eaten up some of their advantage after all global textile quotas were removed on January 1, 2005.
But China was not the only nation to post dramatic gains in 2005. Imports from the Czech Republic, for instance, skyrocketed 1276% in 2005 (rising from 110,000 kg in 2004 to 1.5 million kg), while nonwoven roll goods shipments from Taiwan to the U.S. were up by 86% (from 569,000 kg in 2004 to almost 1.1 million kg). And, while they shipped less than 1 million kg in 2005, several other countries witnessed significant increases in 2005, including Australia (up 243% from 271,000 kg in 2004 to nearly a million in 2005), Egypt (up 340% from 141,000 kg in 2004) and Malta (up 15,228% from 3000 kg in 2004).
